Evaluating container CPU workloads in Nomad
Nomad has been getting a lot of press lately with its ecosystem partners Consul and Value. You probably already know, but Nomad is a scheduler of various sorts; docker containers, java processes, other task drivers… It simply executes jobs on fleets of clients/worker nodes, passing parameters about those tasks/task groups/jobs to the underlying task drivers. Resource constraints are defined on resource stanza for CPU, memory, network and GPU settings.
When a task attempts to use more resources than its allocated, like a process reads an exceptionally large file into memory when the file is normally tiny, the task driver and underlying sub-system (like Docker) might OOM kill the allocation (the placement of the task). CPU restrictions are a bit trickier, though, first because Nomad runs by default with a config called
cpu_hard_limit set to false. This means that compute workloads can burst beyond their allocated, scheduled, and placed amounts. There are benefits to this bustiness, but there are also drawbacks. Benefits are given to applications with unpredictable workloads that are prone to sudden spikes in utilization. A cluster with a bunch of workloads that use over their allocation and those that are chronically under should be balanced.
Balancing is hard in Nomad. Metric reporting to systems like prometheus shows the CPU utilization for a task as a percentage of a CPU core on that client; i.e. %3.2 or %191.4. Comparing this value against the MHz in the resource stanza for the task is difficult. That’s why I wrote nomadWorkloadCPUActualsReport.
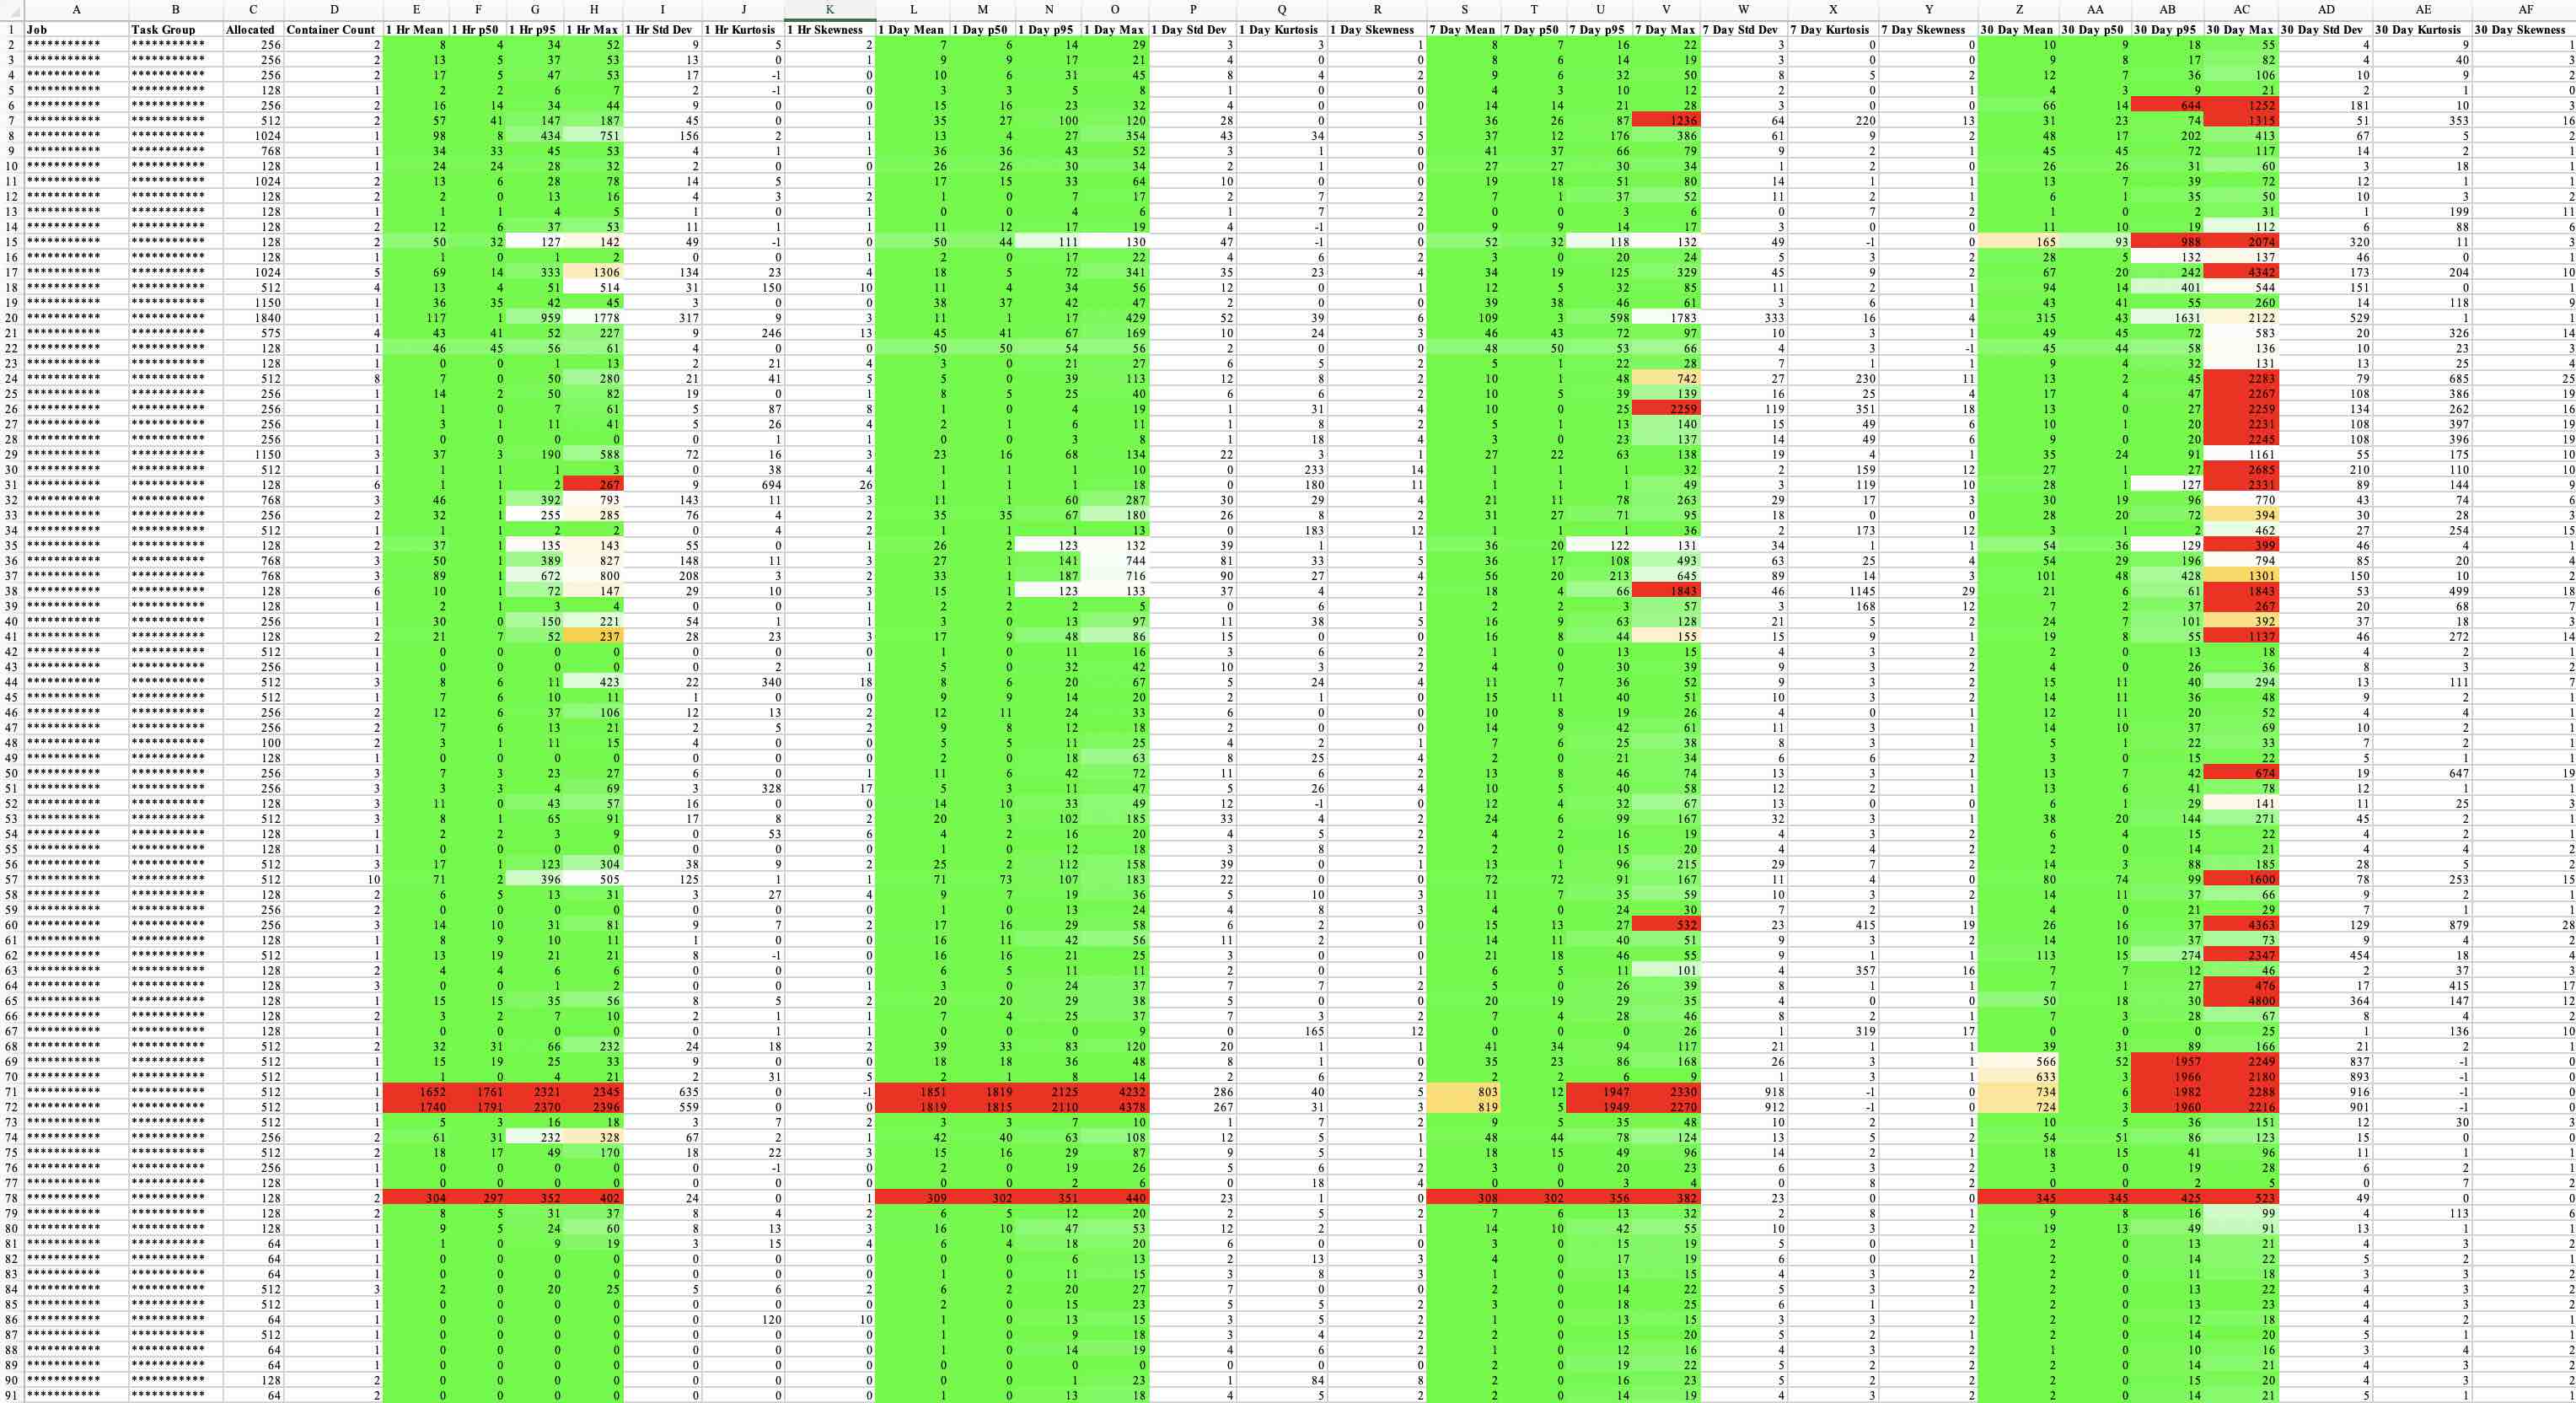
This tool queries Nomad for its clients and their CPU clockspeeds, all the given tasks across the fleet of machines, then compares and cross references that information about task CPU utilization. The tool then renders this data in the same format, MHz, as the resource stanza letting operators know what workloads are chronically use more or less than their expected, configured amount. The tool renders in three colors; red for any workload over 2x allocation, yellow for anything up to 2x allocation, and green for anything under allocation (to zero). Yellow and green render stronger, bolder, when they’re close to their limits 2x and 0, respectively. This allows users to quickly identify how things are behaving within a given period. Information about the shape of the data is additionally rendered like std dev, kurtosis, and skewness.
The tool can hit multiple environments at once, supports sleep operations, supports fallback clock calculations, and by default queries for the past hour, day, week, month, and, optionally 90 days.
Here’s a sample output of the application:
usage: ./nomadWorkloadCPUActualsReport -e <comma delimited environments> <other args>
Nomad Workload CPU Actuals Report
 -avg,--avgKnownNomadClients           Use instead of --nomadFallbackClock to average the known Nomad clients for historical workloads
 -d1d,--disableOneDayQuery             Disable 1 day query
 -d1h,--disableOneHourQuery            Disable 1 hour query
 -d30d,--disableThirtyDayQuery         Disable 30 day query
 -d7d,--disableSevenDayQuery           Disable 7 day query
 -e,--environments <arg>               Environments (comma delimited)
 -e90d,--enableNinetyDayQuery          Enable 90 day query
 -fbc,--nomadFallbackClock <arg>       The approximate clockspeed of out-of-service Nomad nodes that were used to run historical workloads tracked in Prometheus [defaults to 2300]
 -h,--help                             Usage Information
 -nc,--nomadTLSCertFilename <arg>      Nomad TLS Key Filename [defaults to %env%.nomad.key]
 -nca,--nomadTLSCACertFilename <arg>   Nomad TLS CA Certificate Filename [defaults to nomadca.crt]
 -nh,--nomadHost <arg>                 Nomad host [defaults to https://nomad.service.%env%-dc1.consul:4646]
 -nk,--nomadTLSKeyFilename <arg>       Nomad TLS Certificate Filename [defaults to %env%.nomad.crt]
 -ph,--prometheusHost <arg>            Prometheus host [defaults to http://prometheus-read.service.%env%-dc1.consul:9090]
 -qst,--querySleepTime <arg>           Query sleep time in seconds [defaults to 0]
Environment queries are run in parallel to reduce report generation time. Use %env% to inject environment into --nomadTLSKeyFilename, --nomadTLSCertFilename, --nomadHost, --prometheusHost
The full source of which is linked above and here:
#!/usr/bin/env groovy

@Grapes([
    @Grab(group='org.apache.commons', module='commons-math3', version='3.6.1'),
    @Grab(group='com.hashicorp.nomad', module='nomad-sdk', version='0.10.5.0'),
    @Grab(group='com.google.guava', module='guava', version='29.0-jre'),
    @Grab(group='org.apache.poi', module='poi', version='4.1.2'),
    @Grab(group='org.apache.poi', module='poi-ooxml', version='4.1.2')
])

import java.awt.Color
import java.time.LocalDateTime
import java.time.format.DateTimeFormatter
import java.util.concurrent.CountDownLatch
import java.util.concurrent.LinkedBlockingQueue
import java.util.concurrent.TimeUnit
import java.math.BigDecimal
import java.math.MathContext
import java.math.RoundingMode
import groovy.json.JsonSlurper
import groovy.lang.Delegate
import groovy.transform.Canonical
import org.apache.commons.math3.stat.descriptive.DescriptiveStatistics
import org.apache.poi.ss.usermodel.FillPatternType
import org.apache.poi.ss.usermodel.IndexedColors
import org.apache.poi.xssf.usermodel.XSSFColor
import org.apache.poi.xssf.usermodel.XSSFWorkbook
import com.google.common.base.Stopwatch
import com.hashicorp.nomad.javasdk.NomadApiClient
import com.hashicorp.nomad.javasdk.NomadApiConfiguration

def envReplacement = '%env%'
def defaultFallbackNomadClock = '2300'
def defaultQuerySleepTime = '0'
def defaultNomadTLSCACertFilename = 'nomadca.crt'
def defaultNomadTLSKeyFilename = "${envReplacement}.nomad.crt"
def defaultNomadTLSCertFilename = "${envReplacement}.nomad.key"
def defaultNomadHost = "https://nomad.service.${envReplacement}-dc1.consul:4646"
def defaultPrometheusHost = "http://prometheus-read.service.${envReplacement}-dc1.consul:9090"

def cli = new CliBuilder(header: 'Nomad Workload CPU Actuals Report', usage:'./nomadWorkloadCPUActualsReport -e <comma delimited environments> <other args>', width: -1, footer: "Environment queries are run in parallel to reduce report generation time. Use ${envReplacement} to inject environment into --nomadTLSKeyFilename, --nomadTLSCertFilename, --nomadHost, --prometheusHost")
cli.nca(longOpt: 'nomadTLSCACertFilename', "Nomad TLS CA Certificate Filename [defaults to ${defaultNomadTLSCACertFilename}]", args: 1, defaultValue: defaultNomadTLSCACertFilename)
cli.nk(longOpt: 'nomadTLSKeyFilename', "Nomad TLS Certificate Filename [defaults to ${defaultNomadTLSKeyFilename}]", args: 1, defaultValue: defaultNomadTLSKeyFilename)
cli.nc(longOpt: 'nomadTLSCertFilename', "Nomad TLS Key Filename [defaults to ${defaultNomadTLSCertFilename}]", args: 1, defaultValue: defaultNomadTLSCertFilename)
cli.h(longOpt: 'help', 'Usage Information')
cli.fbc(longOpt: 'nomadFallbackClock', args:1, "The approximate clockspeed of out-of-service Nomad nodes that were used to run historical workloads tracked in Prometheus [defaults to ${defaultFallbackNomadClock}]", defaultValue: defaultFallbackNomadClock, type: Integer)
cli.avg(longOpt: 'avgKnownNomadClients', 'Use instead of --nomadFallbackClock to average the known Nomad clients for historical workloads')
cli.e(longOpt: 'environments', args: 1, 'Environments (comma delimited)', required: true)
cli.d1h(longOpt: 'disableOneHourQuery', 'Disable 1 hour query')
cli.d1d(longOpt: 'disableOneDayQuery', 'Disable 1 day query')
cli.d7d(longOpt: 'disableSevenDayQuery', 'Disable 7 day query')
cli.d30d(longOpt: 'disableThirtyDayQuery', 'Disable 30 day query')
cli.e90d(longOpt: 'enableNinetyDayQuery', 'Enable 90 day query')
cli.qst(longOpt: 'querySleepTime', args: 1, "Query sleep time in seconds [defaults to ${defaultQuerySleepTime}]", type: Long, defaultValue: defaultQuerySleepTime)
cli.nh(longOpt: 'nomadHost', args: 1, "Nomad host [defaults to ${defaultNomadHost}]", defaultValue: defaultNomadHost)
cli.ph(longOpt: 'prometheusHost', args: 1, "Prometheus host [defaults to ${defaultPrometheusHost}]", defaultValue: defaultPrometheusHost)

def cliOptions = cli.parse(args)

// if error in cli parsing or missing values, exit
if (!cliOptions) {
  System.exit(-1)
}

// if the user requested help menu, display usage and exit
if (cliOptions.help) {
  cli.usage()
  System.exit(0)
}

def printErr = System.err.&println

// timers and dates for file output
def totalTimeStopwatch = new Stopwatch().start()
def startTime = LocalDateTime.now()

// environments to scrutinize
def envs = cliOptions.environments.replaceAll('\\s','').split(',')
println "Processing for environments: ${envs}"

// various wait, timeouts, etc...
def perTaskQuerySleepTime = TimeUnit.SECONDS.toMillis(cliOptions.querySleepTime)

def queuePollAndOfferWaitTime = 30L
def mathContext = new MathContext(14)

// header values used for each sheet in the excel doc
def perQueryWindowMetrics = ['Miss Rate', 'Mean', 'p50', 'p95', 'Max', 'Std Dev', 'Kurtosis', 'Skewness']
def headerValues = ['Job', 'Task Group', 'Allocated', 'Container Count']

if (!cliOptions.disableOneHourQuery) headerValues.addAll(perQueryWindowMetrics.collect { metric -> "1 Hr ${metric}" })
if (!cliOptions.disableOneDayQuery) headerValues.addAll(perQueryWindowMetrics.collect { metric -> "1 Day ${metric}" })
if (!cliOptions.disableSevenDayQuery) headerValues.addAll(perQueryWindowMetrics.collect { metric -> "7 Day ${metric}" })
if (!cliOptions.disableThirtyDayQuery) headerValues.addAll(perQueryWindowMetrics.collect { metric -> "30 Day ${metric}" })
if (cliOptions.enableNinetyDayQuery) headerValues.addAll(perQueryWindowMetrics.collect { metric -> "90 Day ${metric}" })

// workbook for excel doc, font for header
def workbook = new XSSFWorkbook()
def headerFont = workbook.createFont()
headerFont.setBold(true)
def headerCellStyle = workbook.createCellStyle()
headerCellStyle.setFont(headerFont)

// colors to use for sheet highlighting
def orange = Color.ORANGE
def orangeHue = Color.RGBtoHSB(orange.red, orange.green, orange.blue, null)[0]
def green = Color.GREEN
def greenHue = Color.RGBtoHSB(green.red, green.green, green.blue, null)[0]

// closure that colors a cell based on how far the cell value is from the expected
def styleCellForValues = { allocated, actual ->

  def color

  // eq values are colorless, overages are graident orange, overages over 2x are solid red, underutilizations are gradient green
  if (allocated == actual) {
    color = Color.WHITE
  } else if (allocated > actual) {
    color = Color.getHSBColor(greenHue, (1 - actual / allocated).floatValue(), 1f)
  } else {

    def actualExceedingAllocated = (actual / allocated - 1).floatValue()

    if (actualExceedingAllocated >= 1.0f) {
      color = Color.RED
    } else {
      color = Color.getHSBColor(orangeHue, actualExceedingAllocated, 1f)
    }
  }

  def xssfColor = new XSSFColor(color, workbook.getStylesSource().getIndexedColors())

  def style = workbook.createCellStyle()
  style.setFillForegroundColor(xssfColor)
  style.setFillPattern(FillPatternType.SOLID_FOREGROUND)

  style
}

// takes a pre-created poi row and adds cells for the stats results
def addValuesToRow = { row, allocated, stats ->

  def missRateCell = row.createCell(row.getLastCellNum())
  missRateCell.setCellValue("% ${stats.getMissRate()}")

  def meanCell = row.createCell(row.getLastCellNum())
  def mean = stats.mean as Integer
  meanCell.setCellValue(mean)
  meanCell.setCellStyle(styleCellForValues(allocated, mean))

  def p50Cell = row.createCell(row.getLastCellNum())
  def p50 = stats.getPercentile(50.0) as Integer
  p50Cell.setCellValue(p50)
  p50Cell.setCellStyle(styleCellForValues(allocated, p50))

  def p95Cell = row.createCell(row.getLastCellNum())
  def p95 = stats.getPercentile(95.0) as Integer
  p95Cell.setCellValue(p95)
  p95Cell.setCellStyle(styleCellForValues(allocated, p95))

  def maxCell = row.createCell(row.getLastCellNum())
  def max = stats.max as Integer
  maxCell.setCellValue(max)
  maxCell.setCellStyle(styleCellForValues(allocated, max))

  row.createCell(row.getLastCellNum()).setCellValue(stats.standardDeviation as Integer)
  row.createCell(row.getLastCellNum()).setCellValue(stats.kurtosis as Integer)
  row.createCell(row.getLastCellNum()).setCellValue(stats.skewness as Integer)
}

// concurrent structures for faster processing
def queue = new LinkedBlockingQueue(1)
def latch = new CountDownLatch(envs.size())

@Canonical class StatsWithMissData {

  static def mathContext = new MathContext(2, RoundingMode.HALF_UP)

  @Delegate DescriptiveStatistics stats
  def totalResults
  def missResults

  BigDecimal getMissRate() {
    if (totalResults) {
      def missResults = new BigDecimal(missResults, mathContext)
      def missRate = missResults.divide(new BigDecimal(totalResults, mathContext), mathContext)
      missRate.movePointRight(2)
    } else {
      BigDecimal.ZERO
    }
  }
}

// class that allows for data movement through processing threads to background thread
@Canonical class ContainerStats {

  def environment
  def job
  def taskGroup
  def allocatedMHz
  def count
  def hourStats
  def dayStats
  def weekStats
  def monthStats
  def quarterYearStats
}

// loop through environments, start threads
envs.each { environment ->

  Thread.start {

    try {

      def perEnvironmentStopwatch = new Stopwatch().start()
      println "Beginning to gather data for ${environment}..."

      def prometheusHost = cliOptions.prometheusHost.replaceAll(envReplacement, environment)

      def nomadConfig = new NomadApiConfiguration.Builder()
        .setAddress(cliOptions.nomadHost.replaceAll(envReplacement, environment))
        .setTlsCaFile(cliOptions.nomadTLSCACertFilename)
        .setTlsSkipVerify(false)
        .setTlsCertAndKeyFiles(cliOptions.nomadTLSCertFilename.replaceAll(envReplacement, environment), cliOptions.nomadTLSKeyFilename.replaceAll(envReplacement, environment))
        .build()
      def nomadApiClient = new NomadApiClient(nomadConfig)

      def jobsToTaskGroups = [:]
      def taskGroupToAllocatedMHZ = [:]
      def taskGroupToCount = [:]
      def jobsQueryStopwatch = new Stopwatch().start()

      // get a list of all services in nomad
      nomadApiClient.getJobsApi().list().getValue().findAll { job ->
        job.type == 'service'
      }.each { job ->
        try {

          nomadApiClient.getJobsApi().info(job.name).getValue().each { jobDetail ->
            jobsToTaskGroups.put(job.name, [])
            jobDetail.getTaskGroups().each { taskGroup ->

              // compute the sum of all task group, tasks CPU resource definitions
              def totalCPUResourcesForAllTasksInTaskGroup = taskGroup.tasks.collect { task ->
                task.resources.cpu
              }.sum()

              taskGroupToCount.put(taskGroup.name, taskGroup.count)
              taskGroupToAllocatedMHZ.put(taskGroup.name, totalCPUResourcesForAllTasksInTaskGroup as Integer)
              jobsToTaskGroups.get(job.name).add(taskGroup.name)
            }
          }
        } catch (Exception e) {
          printErr "An exception occurred; ${e}"
        }
      }

      jobsQueryStopwatch.stop()
      println "Finished building list of jobs and task groups for ${environment} in ${jobsQueryStopwatch.elapsed(TimeUnit.MILLISECONDS)} ms"

      def nomadClientsQueryStopWatch = new Stopwatch().start()
      def nomadClientsToCPUFrequency = [:]

      // add clock frequencies for known nomad instances
      nomadApiClient.getNodesApi().list().getValue().each { nomadClient ->
        nomadApiClient.getNodesApi().info(nomadClient.id).getValue().each { nomad ->
          nomadClientsToCPUFrequency.put(nomad.name, new BigDecimal(nomad.getAttributes().get('cpu.frequency')))
        }
      }

      def averageKnownClientFrequency = nomadClientsToCPUFrequency.values().sum() / nomadClientsToCPUFrequency.values().size()

      nomadClientsQueryStopWatch.stop()
      println "Finished building list of nomad clients for ${environment} in ${nomadClientsQueryStopWatch.elapsed(TimeUnit.MILLISECONDS)} ms"

      def slurper = new JsonSlurper()

      // closure to open url, parse, and report back on stats
      def slurpAndReport = { url ->

        def sumStats = new DescriptiveStatistics()

        def totalResults = 0
        def missResults = 0

        try {

          def parsedResponse = slurper.parse(url.toURL())

          parsedResponse.data.result.each { result ->

            result.values.each { value ->

              totalResults++

              def snapshotCPUTotalPercent = new BigDecimal(value.last(), mathContext)
              def snapshotCPUAsLoadAverage = snapshotCPUTotalPercent.movePointLeft(2)

              if (nomadClientsToCPUFrequency.containsKey(result.metric.host)) {
                sumStats.addValue(snapshotCPUAsLoadAverage.multiply(nomadClientsToCPUFrequency.get(result.metric.host)).doubleValue())
              } else if (cliOptions.avgKnownNomadClients) {
                sumStats.addValue(snapshotCPUAsLoadAverage.multiply(averageKnownClientFrequency).doubleValue())
                missResults++
              } else {
                sumStats.addValue(snapshotCPUAsLoadAverage.multiply(cliOptions.nomadFallbackClock).doubleValue())
                missResults++
              }
            }
          }
        } catch (Exception exception) {

          // usually this would be related to prometheus 500-ing because this is leaning against it too hard
          println "Error occurred in opening, parsing, and processing results from prometheus for url ${url}, exception: ${exception}"
        }

        new StatsWithMissData(sumStats, totalResults, missResults)
      }

      // loop through each job, task group and query prometheus
      jobsToTaskGroups.each { job, listOfTaskGroups ->

        listOfTaskGroups.each { taskGroup ->

          def prometheusTaskGroupQueryStopwatch = new Stopwatch().start()
          def prometheusQueryBase = """${prometheusHost}/api/v1/query?query=avg_over_time(nomad_client_allocs_cpu_total_percent{task="${taskGroup}"}"""

          // offer data to the queue
          queue.offer(new ContainerStats(environment,
            job,
            taskGroup,
            taskGroupToAllocatedMHZ.getOrDefault(taskGroup, 0),
            taskGroupToCount.getOrDefault(taskGroup, 0),
            cliOptions.disableOneHourQuery ? null : slurpAndReport("${prometheusQueryBase}[30s])[1h:30s]"),
            cliOptions.disableOneDayQuery ? null : slurpAndReport("${prometheusQueryBase}[5m])[1d:5m]"),
            cliOptions.disableSevenDayQuery ? null : slurpAndReport("${prometheusQueryBase}[30m])[7d:30m]"),
            cliOptions.disableThirtyDayQuery ? null : slurpAndReport("${prometheusQueryBase}[1h])[30d:1h]"),
            cliOptions.enableNinetyDayQuery ? slurpAndReport("${prometheusQueryBase}[6h])[90d:6h]") : null), queuePollAndOfferWaitTime, TimeUnit.SECONDS)

          prometheusTaskGroupQueryStopwatch.stop()
          println "Finished querying prometheus for ${environment}, job ${job} and task group ${taskGroup} in ${prometheusTaskGroupQueryStopwatch.elapsed(TimeUnit.MILLISECONDS)} ms"

          Thread.sleep(perTaskQuerySleepTime)
        }
      }

      nomadApiClient.close()

      perEnvironmentStopwatch.stop()
      println "Finished building data for ${environment} in ${perEnvironmentStopwatch.elapsed(TimeUnit.SECONDS)} seconds"

    } catch (Exception e) {
      printErr "An exception occurred; ${e}"
    } finally {
      latch.countDown()
    }
  }
}

// create the sheets and headers
envs.each { environment ->

  def sheet = workbook.createSheet(environment)
  def headerRow = sheet.createRow(0)

  headerValues.eachWithIndex { headerValue, index ->
    def cell = headerRow.createCell(index)
    cell.setCellValue(headerValue)
    cell.setCellStyle(headerCellStyle)
  }
}

// this is effectively latch.await()
while (latch.count > 0L) {

  // keep the loop from running crazy out of control while the environment processing threads spin up
  def containerStats = queue.poll(queuePollAndOfferWaitTime, TimeUnit.SECONDS)

  if (containerStats) {

    def sheet = workbook.getSheet(containerStats.environment)

    def row = sheet.createRow(sheet.lastRowNum + 1)
    row.createCell(0).setCellValue(containerStats.job)
    row.createCell(1).setCellValue(containerStats.taskGroup)
    row.createCell(2).setCellValue(containerStats.allocatedMHz)
    row.createCell(3).setCellValue(containerStats.count)

    if (containerStats.hourStats) addValuesToRow(row, containerStats.allocatedMHz, containerStats.hourStats)
    if (containerStats.dayStats) addValuesToRow(row, containerStats.allocatedMHz, containerStats.dayStats)
    if (containerStats.weekStats) addValuesToRow(row, containerStats.allocatedMHz, containerStats.weekStats)
    if (containerStats.monthStats) addValuesToRow(row, containerStats.allocatedMHz, containerStats.monthStats)
    if (containerStats.quarterYearStats) addValuesToRow(row, containerStats.allocatedMHz, containerStats.quarterYearStats)
  }
}

// reize columns
envs.each { environment ->
  def sheet = workbook.getSheet(environment)
  sheet.getRow(0).getLastCellNum().times { number ->
    sheet.autoSizeColumn(number)
  }
}

// write the workbook to a file
new File("container_env_snapshot_as_of-${startTime.format(DateTimeFormatter.ISO_LOCAL_DATE_TIME)}.xlsx").withOutputStream { stream ->
  workbook.write(stream)
}

workbook.close()

totalTimeStopwatch.stop()
println "Finished job in ${totalTimeStopwatch.elapsed(TimeUnit.SECONDS)} seconds"
Check it out! It only requires Groovy, Prometheus and Nomad.